
Since the 2012 article released by Harvard Business Review called Data Science the sexiest job of the 21st century, the field has taken all industries by storm. Data Science jobs never fail to reach the top-ranked best job listings – It’s no surprise that one job listing could receive 200-300 applicants per day. An article by Forbes stated that “From 2010 to 2020, the amount of data created, captured, copied, and consumed in the world increased from 1.2 trillion gigabytes to 59 trillion gigabytes, an almost 5000% growth”. At this current rate, we are completely drowning in data, and businesses across various industries have been looking for ways to capitalize on its presence.
To some, it may be like deja vu, but to others that lived through the boom of the software engineering days, they may be seeing a familiar pattern forming. Essentially what happened was that everyone doing software engineering wanted to maintain, or develop, their competitive edge in the market so they were determined to deliver high-quality products into the marketplace, which in turn led to the revolution in regards to methods and the tools being used – some examples include Agile, DevOps, CI/CD, and much more.
However, where things differ between software engineering and Data Science is that a software engineer essentially learns in order to build whereas, in the case of a Data Scientist, the learning typically comes after building. Nonetheless, that is not to say that Data Science does not have anything to learn from its cousin, software engineering. In fact, the reality is quite the opposite.
Read next
What is a Data Science workflow?
Generally, a workflow describes the way people perform tasks to get the work done. To illustrate what a typical workflow looks like, we’d list a series of steps that ought to be completed sequentially using a diagram or a checklist.
“A workflow consists of an orchestrated and repeatable pattern of business activity enabled by the systematic organization of resources into processes that transform materials, provide services, or process information It can be depicted as a sequence of operations, declared as work of a person or group, an organization of staff, or one or more simple or complex mechanisms.” [Source: Wikipedia]
This is the essence of a Data Science workflow; The Data Science workflow expounds the different steps taken within a Data Science project. Since the purpose of a workflow is to illustrate how to get stuff done, using a well-defined Data Science workflow is extremely useful given that it serves as a reminder to all team members of what work has been done, and what is yet to be done.
The development of a workflow
The simple answer to ‘where does the Data Science workflow come from?’ is software engineering, but as most things, it’s really not that simple. Firstly, Software Engineers are engineers, therefore whenever they learn something new, the goal is to build. On the other hand, Data Scientists are scientists before they are engineers (that’s if they have any engineering capabilities), therefore, building only comes after they’ve learned.
Thence, the relationship a Data Scientists would have with code is different to that of an engineer. It’s rare that a Data Scientist would be thinking about coding best practices while they are experimenting – instead, they’d wish to learn something valuable from the insights of the experiment. Therefore, Data Scientists leverage code to derive insights from data and arrive at answers to interesting questions that were formulated at the beginning of the project.
Despite the discrepancies, the best practices used for Data Science teams were actually borrowed from the software development best practices. Although there are multitudes of development workflows, a commonality among them is that they all typically include steps to define specifications, writing code, code reviews, code testing, code integrations, and deployment of the system to a production environment so that it could serve a purpose for the business.
In the same way, Data Science workflows have commonalities of their own.
General aspects of a Data Science workflow
Due to the nature of Data Science problems – we don’t know the end from the beginning – it’s very hard to define a concrete template that ought to be used universally when approaching Data Science problems. Depending on the problem and data, the roadmap of how you’d want to approach a task may vary, hence it’s down to the team to define a structure that’s suitable.
Nonetheless, we do witness very common steps when approaching many different problems, regardless of the dataset. Let’s take a look at these steps.
Note: In no way is the process defined below linear. Data Science projects are quite iterative and many stages are repeated and/or revisited.
Defining the problem
Defining a problem is not as easy as it may seem since there are many factors to consider to ensure the correct problem is being tackled. Questions to consider whilst defining the problem are as follows;
- What problem are we trying to solve?
- What challenges are our customers facing when using our product/service?
- What insights would we like to know more about?
- What problems are we currently facing?
The ability to state clearly what the problem is more of an art, but it’s an essential first step before conducting any Data Science project. Without a compass that all members of the team are following, it’s really easy to spend lots of time doing lots of things without making much progress towards adding business value.
Read also
Data collection
Data is where most bottlenecks occur in industrial Data Science projects; It’s quite rare that all of the data we need is readily available, therefore, it’s important we know some techniques to acquire data. This phenomenon is known as Data Acquisition.
According to wikipedia, Data Acquisition is described as the process of sampling signals that measure real world physical conditions and converting the resulting samples into digital numeric values that can be manipulated by a computer [Source: Wikipedia].
There are a variety of ways to acquire data, here’s some ideas:
- Public Data
- Data Scraping
- Product Intervention
- Data Augmentation
Essentially, Data can come from a variety of sources – there are some gotchas but detailing them is beyond the scope of this article.
Data exploration
Once the data has been collected is made accessible to the Data Scientists it’s important that time is spent becoming acquainted with the data.
During this phase, it’s important to develop hypotheses about the data, whilst searching for patterns and anomalies. You also want to determine the type of problem being solved, i.e. is this a supervised learning task or an unsupervised learning task? Is it a classification task or regression task? Are we trying to predict something or are we inferring something?
- Supervised Learning involves building a model that learns the function which maps an input to an output based on examples of input-output pairs.
- Unsupervised Learning involves building a model that learns patterns from unlabeled data.
- Classification is a form of supervised learning which refers to a modeling problem where the output of the model is a discrete label.
- Regression is a form of supervised learning which refers to a modeling problem where the output of the model is continuous.
The main gist is that we wish to understand our data well enough to develop hypotheses that we could potentially test when we get to the next phase of the workflow – modeling the data.
Modeling
Once, we’ve explored the data comprehensively, we would have a much better idea of the type of problem we are faced with and hopefully would have generated some hypotheses in the previous stage that we could try out.
Since Data Science is a science, it’s likely that we are going to have to test a variety of various solutions before we could conclude on how we wish to proceed with our project. Each experiment or iteration would involve 3 stages;
- Building involves learning and generalizing a machine learning algorithm using training data.
- Fitting involves measuring the machine learning models ability to generalize to never seen before examples that are similar to the data it was trained on.
- Validation involves evaluating a trained model using testing data which comes from a different portion of the training data.
Might be useful
Learn how you can compare your experiments consistently using neptune.ai.
Communicating the results
Many Data Scientists spend the early stages of their careers obsessing over Machine Learning Algorithms and obsessing over the state of the art, however, as time goes on many begin to realize that their attention should be diverted to what is known as soft skills.
Communicating your results clearly is one of the most important skills to possess as a Data Scientist because you will be doing a lot of it. In this phase, the Data Scientist would be required to communicate the findings, results, and/or story back to various stakeholders. For the most part, these stakeholders aren’t always people that are fully ingrained in Data Science, hence being able to alter your message to be understanding for your audience is a very important part of the Data Scientists workflow.
Existing workflows
Data Science workflows are not a new feat in the field, in fact, there are many frameworks readily available for teams to select from.
Blitzstein & Pfister workflow
Also referred to as The Data Science Process, Blitzstein and Pfister, crafted a framework for Data Science workflows for the Harvard CS 109 course. Blitzstein remarked that the goal of the course was to serve as an introduction to the overall process of Data Science investigation for the people that decided to take the course.

The Blitzstein and Pfister workflow comprises of 5 key phases of a Data Science project;
- Stage 1: Asking an interesting question
- Stage 2: Get the Data
- Stage 3: Explore the data
- Stage 4: Model The Data
- Stage 5: Communicate and Visualize the Results
As previously mentioned, the data science workflow is not a linear process, instead it’s non-linear and extremely iterative. The Data Science Process emphasizes the importance of first establishing a question which is to guide your workflow, as well as the importance of iteration which can be seen by the lines that link each stage to the next and the previous step before.
CRISP-DM
CRISP-DM is short for Cross-Industry Standard Process for Data Mining and is one of the most recognized data science workflow frameworks; The idea of CRISP-DM was to create a standardized process that could be used across industries. CRISP-DM consists of 6 iterative phases that each have their designated tasks that ought to be fulfilled, as well as a set of deliverables (i.e. documentation). Similar to Blitzstein and Pfister’s workflow, projects can loop back to a previous phase as and when required.

As depicted by the flow-chart above, the CRISP-DM workflow consists of 6 key phases as follows;
- Phase 1: Business Understanding
- Phase 2: Data Understanding
- Phase 3: Data Preparation
- Phase 4: Modeling
- Phase 5: Evaluation
- Phase 6: Deployment
OSEMN
OSENM was first described in a 2010 blog post called A Taxonomy of Data Science by Hilary Mason and Chris Wiggins and people often remember the framework by recalling how close sounding OSEMN is to “possum” or “awesome”.
OSEMN, however, is an acronym that stands for Obtain, Scrub, Explore, Model, and iNterpret. It’s likely the majority of Data Scientists would be familiar with each term and should have some comfortability at working on each. Although Data Science will require a combination elements of OSEMN, the authors identified that the “O” and “S” tasks require more data hacking skills, whereas “E” and “M” requires more Machine learning skills, hence no Data Scientist would be an expert at each step.
Since there is no image illustration, I’ll break down each step.
#1 Obtain
To perform Data Science we need data hence this framework defines “O” (obtain) as the first step in the workflow. The authors disapprove of manual processes of data collection (i.e. pointing and clicking using a mouse, copying and pasting from documents, etc.) as inefficient and unscalable.
The most effective way to obtain data, according to the authors, is to adopt a range of tools that would allow you to obtain data automatically for your problem. Such tools include unix command line tools, SQL, web scraping, and shell scripts.
Note: Additionally, the authors mention that APIs are vital to access data
#2 Scrub
More often than note, data that’s obtained would be extremely messy – We can think of data that’s messy as being corrupted (i.e. missing values). Data Scientists often spend a lot of time on this part of the workflow, and many would agree that it is probably the least sexiest part of the sexiest job of the 21st century.
“A simple analysis of clean data can be more productive than a complex analysis of noisy and irregular data.” – A Taxonomy of Data Science
Nonetheless, ensuring that the data is clean, uniform, and consistent could pay extreme dividends in a data project since you’ll always get out what you put in – if you put in junk then you could expect junk results back.
#3 Explore
Data Scientists often refer to the “Explore” phase as Exploratory Data Analysis (or EDA). The idea behind EDA is to gather intelligence about the data at hand. With this intelligence, Data Scientists would then gather ideas that could be further tested when we get to the next phase of the Data Science workflow.
Some tools that are useful for performing EDA in Python are;
- Pandas for data manipulation
- Matplotlib for data visualizations
- Jupyter Notebooks for easy to use interactive Data Science environment
- Dimensionality reduction methods such as PCA
- Clustering algorithms to find the natural groupings in the data
#4 Model
The model phase is where we implement a variety of Machine Learning algorithms to predict a certain outcome. We define the best model as the model which best suits our predefined evaluation metric.
“Often the ‘best’ model is the most predictive model” – A Taxonomy of Data Science
#5 iNterpret
To determine how well a model is performing, we often validate its performance on new unseen instances that were not available to the model during training – The idea is that the model would generalize well to the new unseen instances.
According to the authors, the interpretative power of a model defines the models ability to suggest what the most useful/interesting experiments to perform next would be (this is because the interpretation of the models output should provide more insight into the problem being solved).
A Data Scientist reading this may feel as though the workflows seem obvious, however there is still immense value in defining a workflow ahead of starting a project. As a result, all members of the team would understand exactly what is going on, what is required to be done, and also to keep other members of the team accountable to one another.
Organizing your Data Science projects
Data Science projects normally fit in as a part of a larger system. The actual code we write for our projects is only a small fraction with respect to the entire system, for instance, when creating a fake news classifier, the Machine Learning code is very small in comparison to to the other elements within the same system (i.e. Data Collection, Feature Extraction, Configuration, etc.). It is based on this that I tend to consider such projects as software projects.
Note: The curious reader may want to read Hidden Technical Debt in Machine Learning Systems.
“A layered approach is considered better practice than implementing the protocol as a monolithic block, since implementing conceptually different issues separately reaps several benefits” Buschmann et al. (1996)
Structure describes the predefined arrangement and organization of elements within the development of a Data Science project. It can be time consuming in the beginning but deciding to document and follow a structure is extremely useful for Data Science teams – it tends to pay dividends throughout the course of a project.
Why is structure important?
For those that aren’t yet convinced, here are 2 reasons why spending a bit of time at the beginning of projects to set out a structure is extremely beneficial.
Your future self will thank you
All of the workflows we explored earlier in the article are extremely iterative by nature – this point alone is enough to demonstrate the importance of reproducibility. Somewhere down the line, we may need to reproduce something we have done during one of our experiments, but as a practitioner, this is probably the last place your mind is at. We are more concerned about what experiment we could try next, what we’ve learned from the current experiment, what worked, and what didn’t.
It’s not uncommon for Data Scientists to be engaged with rapid experimentation, visualization, and analysis, however, this type of work state is not one that lends itself to structural thinking – experiments are messy!
Without a formal structure in place, returning to past experiments/projects is a whole new challenge in itself. As the creator of a script, if it is unclear whether the final training script is train.py, new_train.py, or last_train.py, you’re now going to have to spend time going through each script to work out which script actually executes the code – time not well spent.
How embarrassing is it when you tell someone you can do something and they tell you to prove it and when you try, it doesn’t work? Exactly. It’s the same feeling when you are unable to reproduce your own experiments. Keeping a good structure is going to save you a lot of time when you have to perform the inevitable task of revisiting work you’ve done in the past.
Learn more
How to Organize Deep Learning Projects – Examples of Best Practices
How to Structure and Manage Natural Language Processing (NLP) Projects
How to Structure, Organize, Track and Manage Reinforcement Learning (RL) Projects
Others will thank you
Data Science is a team thing and part of being a good team player involves lowering the burden on your teammates by pulling your own weight; Since Data Science may be regarded as a team endeavour, it’s possible that at some point there will be someone that would want to revisit something you’ve completed in the past (i.e. they may want to extend it, validate it, present it, learn, etc.).
This person may be a current team member, someone who has just been hired, or someone who is completely alien to the project within the organization. By maintaining good structure you would have saved bundles of time for anyone that may potentially need to use your work in the future.
Proposed layout
Like Data Science workflows, there is no one size fits all when it comes to defining a structure to follow, but there are some key components that tend to recur in most projects. Once we’ve created our project directory, the first step is to separate code, data, notebooks, and models. Take a look at the image below for a better conceptual understanding.
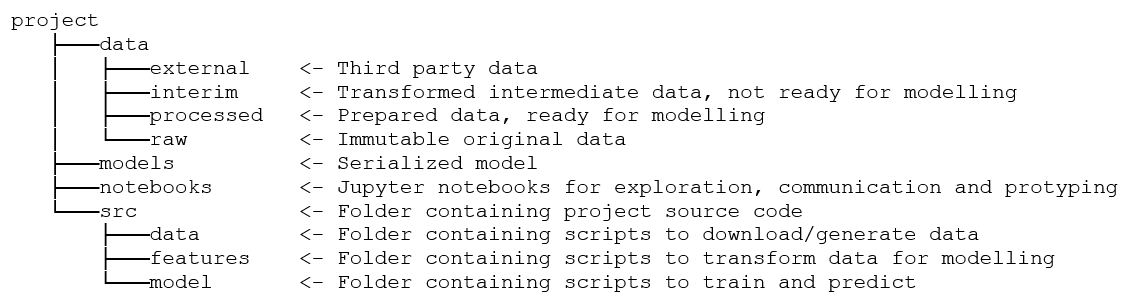
Data
First there’s the data directory which stores all of the data required for the project. There are different types of Data we are going to be working on throughout the course of a project, hence it’s best we keep them separated to avoid any complications whilst performing experiments. Here’s how we could sort our different data directories under the parent Data directory:
- Raw: Storing a local copy of data ensures that the data is stable – if the database is updated on a daily basis it could interfere with the task you are performing on the data in its current state. Data in this directory is immutable, meaning the data stored into this directory would always remain in its raw state.
- External: Data that is extracted from third party sources. Data that lands in this directory should be immutable (meaning you should not save data you’ve transformed in any way into this directory).
- Interim: Any transformation (i.e. joins, merges, etc.) made to the raw data and external data (if available) would be stored in the interim directory. Data in this directory is what would be called for any feature engineering.
- Processed: When we’ve performed our feature engineering on the data, we may then go ahead and store the data into the processed directory. Here, the data is in a state that is prepared to be consumed by a Machine learning algorithm (if required).
Models
The models directory is where we store our serialized Machine learning algorithms after training. We store our models after training because we would need to restore them for inference. But, it’s also a good idea to store models in case we decide to build an ensemble in the future, and to compare models since it’s very likely that we are going to build many over the course of the project.
Notebooks
Notebooks are a much better way to prototype, explore, and communicate insights. Where notebooks lack is in the scalability and reproducibility realms. Although not stated in the image above, it’s also a good idea to divide notebooks into separate sub-directories such as; explorations, prototypes, etc.
Note: Using good naming conventions would help to distinguish each notebook from one another
Src
Src is short for Source code and it’s where all source code is kept. It can be difficult to know exactly what scripts we would need but as a general rule of thumb, you could always expect to be retrieving data, performing feature engineering, and modeling data.
Final thoughts
The best way to determine your team’s workflow and how to go about structuring projects is to assess the members of the team then come up with a set of practices that best fit the values and goals of the team – it may also serve as a good idea to assess existing frameworks and see what could be taken from them.
