Deep Dive Into Error Analysis and Model Debugging in Machine Learning (and Deep Learning)

“Winning a Kaggle competition does not prepare you for real-world data science!” I’ve heard that a lot. When I was still a newbie, I wondered “What? I got 99% accuracy on the leaderboard. That’s almost perfect!” But now I understand what they meant.
Getting good accuracy is like winning a coin toss before a match.
It’s good, but there’s still a lot of work.
In competitions and research, after you train a model, you do error analysis, figure out what’s wrong with the model. Then, make some changes to your model and retrain it on the training set. However, sometimes you get a good validation and test score by using a heavy and complex model. In a competition, you’d stop at this point as you are judged on a single metric. In the industry, there are a few important steps to cover even after getting a great score on your test dataset.
In this post, we will deep dive into why you should scrutinize your model even if you get a good metric.
Specifically, we will look into:
- Analyzing where your model went wrong on your test data, and how to make systematic changes to your model based on these insights.
- Performing error analysis on three levels – Prediction, Data, and Features.
- How to look for bugs and fix them in your model training pipeline.
- Ideas for finding and resolving bugs for a model in production.
Error analysis
For your ML project, if you get 85% accuracy, you should ask yourself – why were the other 15% test examples misclassified? This is usually the starting point of your error analysis.
Ironically, you should also be suspicious if you get 100% performance on your test set. What if there’s a data leak?
Let’s take a look at error analysis on 3 different levels – Predictions, Data, and Features.
Predictions
An easy way to get started is to break down that 15% inaccuracy into something insightful – a confusion matrix. It gives you a sense of any patterns in the inaccuracies. Are the majority of the classes misclassified into a particular class (maybe a majority class in case of imbalance)?

For example, if you’re working on Named Entity Recognition in an email dataset, you might have five classes, of which two are dates. Say the date on which the email was sent and the date on which the email was replied.
It is highly likely that the model does a good job identifying the dates, but struggles with distinguishing the dates into the two classes. In that case, a simple solution is to identify dates as they are and apply some heuristics to distinguish them.
Another way to assess your model overall is to look at how your model performs as compared to your baseline. Is your baseline better at classifying some classes than your complex model? Is the overall improvement marginal? If so, why?
Another way of validating your model’s trustworthiness is to hand-pick predictions. For example, analyzing a few low confidence correct classifications could tell you if the model is having a hard time evaluating easy (from a human point of view) examples. Are the misclassified examples easy to predict? These are indicators that something is wrong on the feature engineering side.

ML Operations has recently been borrowing ideas from software development for measuring the robustness of a model. In software development, every new code has to pass tests before getting shipped. You can create a suite of tests for ML models too.
For example, the minimum expected performance can be assured by testing the model on a few obvious cherry-picked examples. If the model fails at even one of these examples, then it is not fit to go live.
Similarly, one can change a few details in these examples and see the effect. ‘Dwight is a great guy’ and ‘Jim is a great guy’ should have nearly the same sentiment score. In this case, the name was changed.

Data
I cannot count the number of times a model fails because the data is poor quality. And it’s so frustrating when you spend weeks implementing some complex architecture, and then find out that the data had mistakes.
ALWAYS make sure that the data is the way you expect it to be before even implementing the baseline. Because later, you don’t want to wonder if your poor metric is because of your model or your data.
Now, what do I mean by data not being good? Before I answer that, you must remember a golden rule – know thy data:
- How was it generated?
- When was it generated?
- Who generated it?
- How was it stored?
- Was all of it stored?
- You should know everything.
Now we’re ready to talk about good quality data.
Consider an NLP task of identifying named entities from invoice images. To do so, you need the contents of the image in text form. The text was obtained from a third-party OCR (Optical Character Recognition) software.

If you’ve used open-source software like tesseract, chances are that the output text has a lot of spelling errors. This drastically increases your vocabulary size. It becomes tedious to clean all of this mess. As a result, your NER task becomes unnecessarily difficult. Here, the quality of data is poor.
Consider another example where sensors on factory machinery capture data about the machine – temperature, sound levels, etc.

Your task as a Data Scientist is to develop a model to detect anomalous behavior in the machine. It turns out that the sensors were damaged for many weeks and there was no replacement done. Hence, you have lost sizable data. And your data (which has a temporal dimension to it), has a gap.
Another potential problem with the data could be the accuracy of annotations. Again, you should be aware of how the data was annotated. Publicly or by a dedicated team? Did the annotator have an adequate level of expertise to label the data?
A small but important error could be an improper splitting of training and validation data. Not maintaining the distribution in both the sections, especially in imbalanced data can lead to inaccuracies in results.

The example shows fitting a curve on a data with one dimensional input (X axis) and one dimensional continuous predicted variable (Y axis). The train samples cover a certain range in X, which is different from the range in X covered by test examples. Since the training data is not representative of the true curve, the fitted curve is inaccurate. | Source
One common practice is to apply augmentation to your dataset. If you augmented your data, have you applied valid transformations? For example, in image classification between cars and bikes, it hardly makes sense to invert the image vertically to create synthetic examples. It is less likely that the model would see an upside-down car or bike.
Features
After you train your model, how do you check if your features are good? It’s possible that your 99% validation accuracy is a result of poor features – features engineered using a data leak.
In this case, the model will be highly dependent on this feature. This can be verified using SHAP or LIME frameworks (model interpretability). Another common leak is to fit a scaler or a vectorizer on the entire dataset, and then make a split. This should be avoided as you are using validation data indirectly in your training.
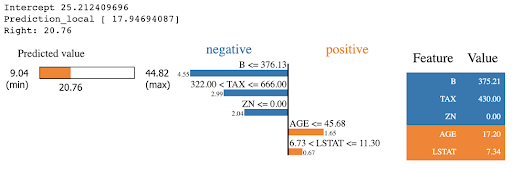
The figure shows how explainers like LIME assign contribution scores to each feature for a prediction. | Source
EDITOR’S NOTE
DALEX is an explainability framework that combines a lot of model interpretation and prediction explanation techniques. You can read about Dalex here.
Different models have different conditions for the data. Distance-based models work better with scaled inputs. Make sure your features obey such assumptions. In addition, features must comply with common-sense rules. For example, if one of the features is human age, you don’t need values as absurd as 200 years. Make sure to write such tests before you modify the data too much.
Analyzing features in Neural Networks is much harder as they are not really explainable. One small trick that can help is to check the distribution of the values of parameters at each layer. A poorly trained network will have several layers with close to zero parameter values or gradients that never flow to a certain region in the network.

Debugging model training pipeline
We looked for errors in the three core components, but there’s room for more.
Model training pipeline is more complicated in Deep Learning systems, mainly because of the flexibility deep learning provides. The hard part is that neural networks fail silently. Often you would be able to run the training code successfully, but you won’t get the desired results. There are ways to find out what’s wrong with the network.
Debugging Deep Learning models
For example, loss curves are very handy in diagnosing deep networks. You can check if your model overfits by plotting train and validation loss curves. You can also check if your learning rate is too high or too low. If the loss curve flattens at a high value early, the learning rate is probably low. If the loss curve follows a zigzag pattern, the learning rate is too high.
While training an LSTM/RNN, spikes in the loss curve point towards exploding gradients. In such cases, clipping the gradients can help.

Attention is a must in modern deep learning models. It improves model performance significantly. However, it’s also a good interpretation tool. Consider a machine translation task. You are required to build an encoder-decoder model to translate English to Polish. Attention weights allow you to visually inspect which English word was most important for a translated polish word.
Some guidelines to train your deep learning model:
- Start with a simple network – No batch-norm, no dropout, no regularization or any fancy tricks. Probably just a CNN/RNN and a classification layer.
- Overfit a single batch of data.
- Manually check the shapes of intermediate and the final output. Even if you don’t find any code errors. Neural Networks fail silently.
- Try to use the DL framework APIs as much as possible and avoid writing your own functions. For example, using Dataloaders, or image transformers from PyTorch instead of writing your own.
- While tuning your model, do not change values of more than one hyperparameter at once. Tune one hyper-parameter at a time.
RELATED
You may want to take a look at this great resource on troubleshooting neural networks.
Assessing models in production
So far we have talked about error analysis in model training. However, there are things to be taken care of in a production environment. Most of the time, you don’t have labels to check if your predictions are correct. You have to rely on heuristics to see if the model performance has degraded.
An ML model is trained on data with a certain distribution. If the data in a production environment has a different distribution, the model performance will be sub-optimal. This problem is common and is known as model drift.
How can we detect this? Since we do not have labels in production, we rely on some proxy measures. For example, if the distribution of features is distinct from the training set features, model drift is a likely possibility.
Assessing models in production is a huge topic, and we have another article just about this problem: Best Practices for Dealing With Concept Drift.
Final thoughts
Error analysis in Machine Learning is not just to improve performance on your target metric, but also to make sure that a model performing well on a static training and validation dataset is just as good in production.
It involves understanding limitations in your training process – data, features or model, and trying to make these aspects as robust as possible. Unfortunately, there is no go-to detailed framework that can be applied to any ML problem. Computer Vision problems might require different error analysis than NLP problems. But that is what makes this process creative!
Hope you learned something. Feel free to check out more amazing ML/AI articles on the Neptune blog.
