
Everyone is excited about machine learning, but only a few know and understand the limitations that keep ML from widespread adoption. ML models are great at specific tasks, but they can also get a lot of things wrong. The key to a successful project is understanding how your model(s) can fail, and preparing appropriate solutions ahead of time.
If you can’t troubleshoot models when they underperform or misbehave, your organization won’t be able to adapt and deploy ML at scale for the long term—and that’s why model debugging is critical.
What is model debugging?
Model debugging studies ML response functions and decision boundaries to detect and correct accuracy, fairness, security, and other problems in ML systems.
Now, If machine learning is software, can’t you just use the same debugging tools that are used for traditional software development?
Why can’t you debug ML models with traditional tools
Debugging ML models is harder than debugging conventional programs, and there are several reasons why:
- Machine learning is more than code
Compared to a traditional codebase, an ML codebase has a lot more moving parts. There are datasets, model weights fine-tuned during training, optimization and its gradients which change during training, and more. You can say the code is “dynamic” during training, after which it stops changing and the semantic bias that the data and model had while training gets ingrained in the code just like an uncaught bug.
The lack of proper tools to inspect the training process is why many of us use print statements and loggers to analyze.
- Monitoring and intervention during ML training is difficult
A lot of ML training code runs on clusters or in the cloud. When you run a distributed training job on a cluster, the main way to monitor progress is to tell your code to generate logs and save them in a central location for analysis. A better alternative is to monitor progress in real-time—it’s essential in an ML debugger.
There are tools dedicated to monitoring the progress of your ML model during training. Here is a list of these tools:
- neptune.ai – Apart from its extensive experiment tracking and monitoring capabilities, it automatically tracks other aspects of the code and compares parameters and metrics in a table. Besides, Neptune’s reporting feature allows you to document your findings and visualize this information in customizable dashboards that offer real-time insights into training progress. You can create live dashboards that track essential metrics such as training loss, validation accuracy, and learning rate in real time. No need to wait for training to finish—see trends as they happen. Check out this example run for LLM monitoring to see how this can look like live.
- Weights and Biases – It helps in visualisation of experiments in real time and it is very easy to integrate. It automates hyperparameter optimization and helps in exploring possible models.
- Comet – Similar to the previous tools, Comet is designed to allow data scientists to track and manage their experiments.
Best Tools for ML Experiment Tracking and Management
- Debugging ML code may take a lot of rewriting or framework switching
ML code is mostly based on higher-level frameworks that eliminate underlying complexities, and this makes models difficult to debug.
How do you debug ML models and what are the tools used for debugging?
Your debugging strategy should take into account three important stages:
- Dataset preparation
- Model building
- Output testing
Let’s look at these strategies, along with the tools for implementing them.
Data-centric debugging for ML models
There are three big steps to make sure that your dataset is in good condition.
1. Validate data quality
Data quality significantly affects model performance. Imbalance, or infrequent features, introduce bias. Since we’re feeding the model data, it’s easy to pick out low-quality data instead of guessing if it’s there when the model predicts badly.
Once we understand the issues which are driving our data to lower quality, we can address them at once. It is advisable to ensure good quality data for experimentation as we will not be able to build a desirable model if it was not created with good quality data. Here are some of the factors contributing towards bad quality data and ways to tackle them:
Imbalanced Data: If collecting more data is not possible to deal with imbalanced data, here are some of the ways to handle it.

- Resampling dataset : Adding copies to the under-represented class or deleting data from an over-represented class can resample the data to be more balanced.
- Imbalance normalised performance matric : Using metrics where the imbalance is normalised like Cohen’s Kappa, paints a clearer picture of model’s prediction accuracy. ROC curves can also be used.
- Generate synthetic data : There are algorithms which can be used to generate synthetic data instead of making copies of data from the minor class like SMOTE (Synthetic Minority Oversampling TEchnique).
How to Deal With Imbalanced Classification and Regression Data
Missing values
The dataset could have rows where the values could be missing. Here are some of the ways to deal with them:
- Drop the rows containing missing values if it doesn’t harm the size of your dataset.
- Impute or Replace the missing values with mean or median. The most frequent or any constant value can be used for categorical features but this can introduce bias in data.
Remove outliers
An outlier can be defined as data whose underlying behaviour is different from the rest of the data. Since our ML models are sensitive to all the data that is fed during training, these outliers, no matter how small they are, can mislead our training process resulting in longer training and less accurate models. One could try these methods to identify and remove the outliers:

- Visualisation : Visualisation helps us understand the degree of associations between our data and remove the outliers by putting a threshold. This is a univariate method as we use one variable for our outlier analysis.
- Mathematical functions : Functions like Z score or IQR score help us establish a relationship between the data and statistically find the outliers. Z-score describes any data point by finding their relationship with standard deviation and mean of the dataset. The Inter Quartile Range score is a measure of statistical dispersion which with a threshold can be used to eliminate outliers.
- Clustering algorithms : Clustering algorithms can be used to cluster data points based on their density and low density clusters could be marked as outliers, e.g., Density based spatial clustering of applications with noise (DBSCAN)
2. Ensure good quality data splits
We have to ensure the data is statistically split equally for training and testing. For example, say we’re making a cat and dog classifier. We had a dataset of 10,000 images, of which 5,000 were of each class. We split the dataset in an 8:2 ratio—8000 images for training and 2000 images for testing:
- Training set = 5000 cat images + 3000 dog images
- Testing set = 2000 dog images
The dataset isn’t statistically split equally, so it would bias our model output for cats because the training set has more examples of cats. Also, while testing, we won’t gain any information about how the model behaves for cat images.
Another thing to keep in mind is choosing the right ratio for splitting your data. An 8:2 training:testing ratio is referred to as the Pareto principle. Ratios may change to fit the data. For a quick summary about ratios, check out this StackOverflow thread.

K fold is another method for splitting the data. With this method it doesn’t matter how the data is split and it proves as a good advantage to consider this method. Here the original data is split into K folds of the same size using random sampling without repetition. The model is then trained K times, each one of them using K-1 fold as training set and 1 as test set. If we set K = n, then it becomes a case of Leave one out! Stratified K fold return startifies folds. The folds are made by preserving the percentage of samples for each class.
Cross-Validation in Machine Learning: How to Do It Right
3. Test engineered data
Features are the main input on which your models are based; they’re derived from raw data, which makes them different. They’re hard to analyze in large numbers while debugging manually. One way to overcome this is to test engineered features with unit tests. Unit tests can be written to test conditions like:
- “All numeric features are scaled.”
- “One-hot encoded vectors only contain single 1 and N-1 zeros.”
- “Missing data are replaced by default(mean) values.”
- “Outliers are handled by scaling or clipping.”
Unit data testing gives you a greater understanding of the data and supports informed decision-making. This also helps in scalability, as it ensures that the data remains accurate and reliable.
For the basics of Unit Testing Data, read Unit Testing Data: What is it and how do you do it?
Now, let’s move on to tools for data validation and/or unit data testing. They’re all open-source, listed alphabetically.
Cerberus guards the door of the data flow by doing validation. It can be used for base functionalities like type checking, but it also does custom validations. It doesn’t have any dependency, so it’s lightweight and easy to implement. It’s designed to be non-blocking, so it’s widely extensible.
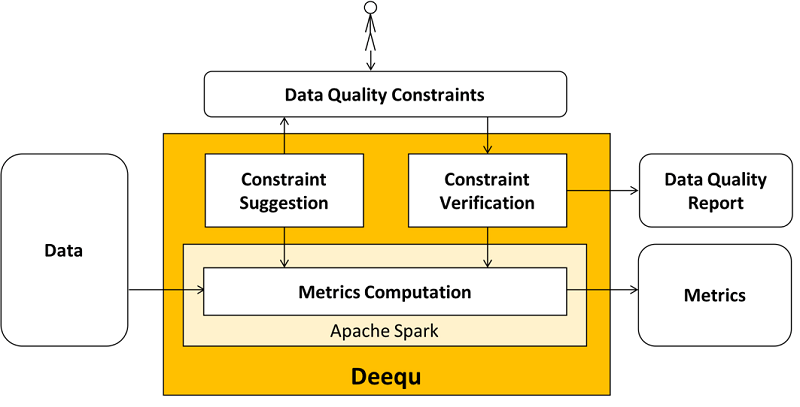
Deequ is a data quality assertion tool built on top of Apache Spark. Based on your definition of quality, Deequ measures relevant KPIs on batch or streaming data and then produces reports on the result. It supports functionalities like data profiling, anomaly detection on data quality metrics over time, automatic constraint suggestions over large datasets, and querying of computed data metrics with a metric repository.
Learn more about the inner workings of Deequ in the paper Automating Large-Scale Data Quality Verification.
Great Expectations is a great library of data assertions that you can use with any pipeline tool. It has four major features.
- Data testing
- Data documentation – it renders clean and human-readable documentation

- Automated data profiling – it auto-generates tests which with domain expertise help to jump-start the process of data testing
- Pluggable, extensible, scalable – each component is extensible and can be scaled for production-ready data validation.
You can use this library to eliminate pipeline debt with great expectations (pun intended).

Click here to find the full documentation of Great Expectations. You can join them on Slack to ask them anything!
4. Griffin
Griffin is a data quality assertion tool with a unified process to measure data quality from different perspectives. It’s built to support large datasets and both streaming and batch mode. It handles data quality issues with three steps:
- Define data quality requirements like completeness, profiling, accuracy, etc.
- Measure data quality based on the defined requirements.
- Report data quality as metrics are evicted to pre-defined destinations.

5. JSON Schema
Using a schema for unit testing might sound strange, but many schema libraries let you enforce data requirements in the specification.
Check out google’s brief and comprehensive explanation of data schema.
Validating data schema is like validating the blueprint of a building. JSON Schema is a powerful tool to do this, and it also lets you test your data in the API layer.
Read ‘Understand JSON Schema’.
Model-centric debugging for ML models
Model interpretability
Your machine learning model is a black box and you want to know why your model makes certain decisions? If you find out why and how it makes the decisions, you can learn about the problem, the data, and also the reasons it might fail. Interpretability explains our ML model black boxes’ mysteries and tells us why they made certain decisions.
Interpreting erroneous predictions provides a direction for fixing the model.
The two main reasons why we need interpretable models are:
- Debugging errors – The purpose of debugging is to find out the reason for an error and resolve the issue. If the model isn’t interpretable, the error can’t be debugged and the issue can’t be resolved at the root cause.
- Predicting edge cases – We already know how they’re built. Now, when models are transparent and we know how they make decisions, we can predict all the outcomes given the data. This warns us of the edge cases, helping us build an efficient ML model.

Interpretability in Machine Learning is a huge topic. I suggest reading Christoph Molnar’s book ‘Interpretable machine learning. A Guide for Making Black Box Models Explainable’. He captured the essence of interpretable ML very well, and with great examples. It’s a great book to understand the subject.
Here are some tools for model interpretation:
Alibi is an open-source library that enables model inspection and interpretation. It lets you closely inspect model performance with respect to concept drift and algorithmic bias. It’s language- and toolkit-agnostic, so it’s easy to integrate and use.
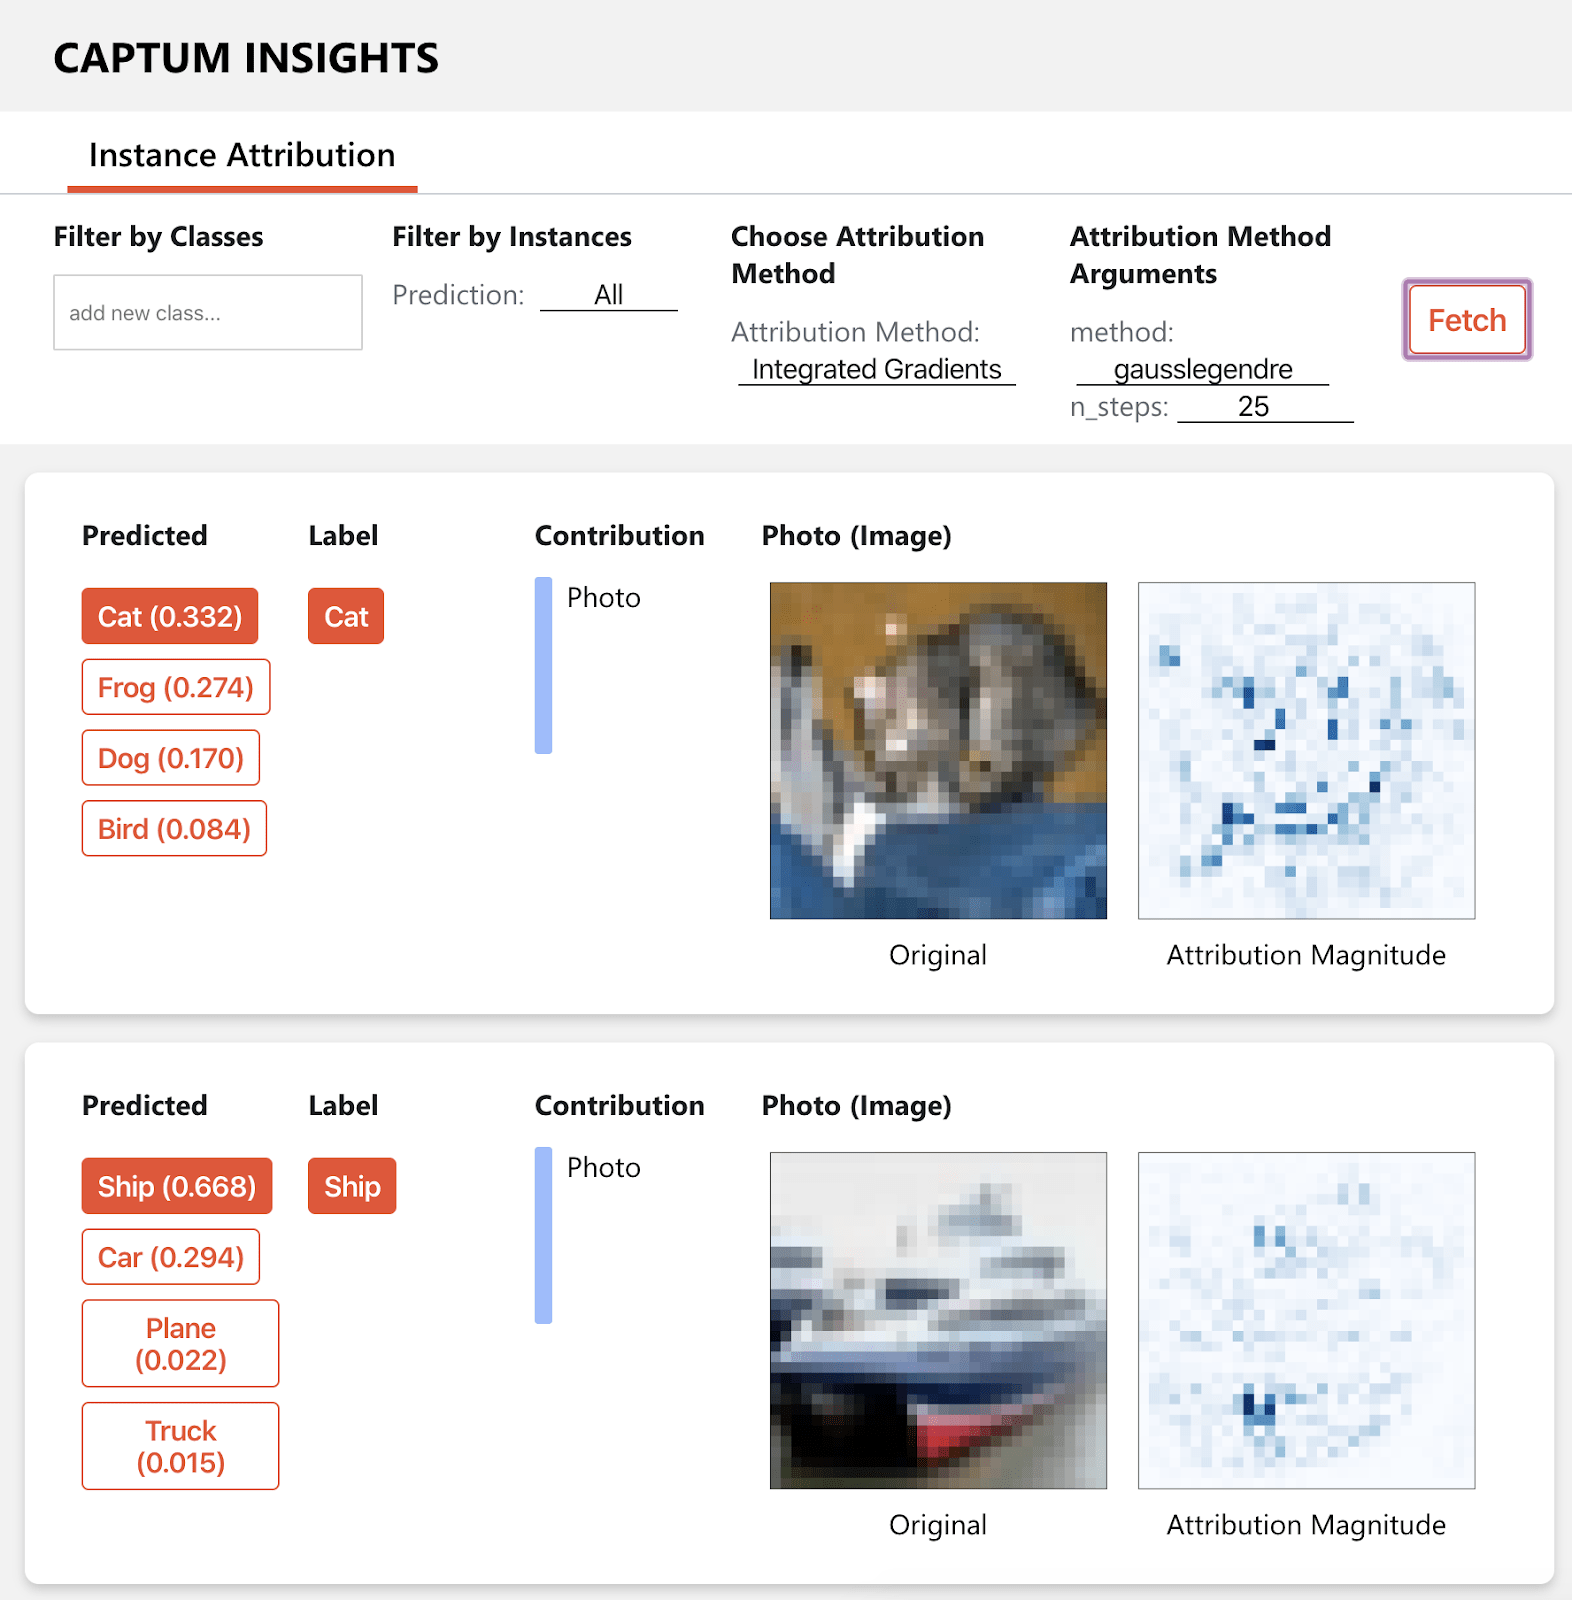
Captum is a model interpretability tool built on Pytorch. It supports models for vision, text, and more. It has Integrated Gradients, so it tries to explain the model in terms of features contributing to model output. It can be easily implemented with algorithms that interact with PyTorch models. It can be used on trained models in production.
An open-source toolkit with state-of-the-art techniques to explain model behavior. It supports glass-box models—easily interpretable models like linear models, decision trees, and black-box explainers for already existing systems. It implements Explainable Boosting Machine, a powerful, interpretable, glass-box model that can be as accurate as many black-box models. InterpretML supports the following techniques:
|
Interpretability Technique
|
Type
|
|
Glassbox model |
|
|
Glassbox model |
|
|
Glassbox model |
|
|
Glassbox model |
|
|
Blackbox explainer |
|
|
Blackbox explainer |
|
|
Blackbox explainer |
|
|
Blackbox explainer |
Check out their paper, InterpretML: A Unified Framework for Machine Learning Interpretability to understand in-depth how it’s working.
Lime, which is short for Local Interpretable Model agnostic Explanations, explains individual predictions for classifiers that act on tables or images. It’s based on the work presented in this paper. It can explain any black-box classifier with two or more classes. It takes a NumPy array or raw test and gives a probability for each class.

Check out the tutorial on the basic usage of LIME with a random forest classifier.
Shap does Shapley’s Additive-based explanation. It’s based on a game theory approach to explaining the output of any ML model. SHAP tries to explain the prediction of an instance by computing the contribution of each feature to the prediction. The SHAP explanation method computes Shapley values from coalitional game theory.
DALEX which is short for Descriptive mAchine Learning EXplanations tool helps analyse and understand at a deeper level how models work.
- The key objective of DALEX is that of an explainer. It creates a wrapper around a predictive model and these wrapped models can then be explored and compared against other local or global explainers.
- DALEX uses various techniques like SHAP, break down, breakdown with interactions to analyse and understand model predictions.
- It uses Ceteris Paribus to plot changes in model predictions to help you understand sensitivity of the model to the changes in feature values.
- It can be created and integrated with popular frameworks like sklearn, keras, lightgbm, etc.
- It can be used with neptune.ai to automatically save and version these explainers and interactive charts for every training.

Prediction-centric debugging for ML models
ML model prediction is usually evaluated using metrics like mean square error (MSE), Area under the curve (AUC), etc. These metrics tell us how the model performs, but not much about why the model performs poorly. We learn how close we are to our goals or desired output, but won’t figure out where the model fails. So, visual debugging tools let us look beyond these metrics, with features like performance comparisons, feature distribution over a dataset, and much more.
Let’s look at some tools for visual debugging:
Manifold is a model-agnostic visual debugging tool from Uber. It visualizes poor model performance by explaining potential issues causing it. It surfaces the feature distribution difference between better and worse performing data subsets. Manifold relies on three key features for explaining model output:
- Performance Comparison View
Visualize an overview performance of your model(s) across different data subsets. Manifold uses a clustering algorithm to break prediction data into N segments based on performance similarity. This helps you pick out under-performing subsets to inspect.

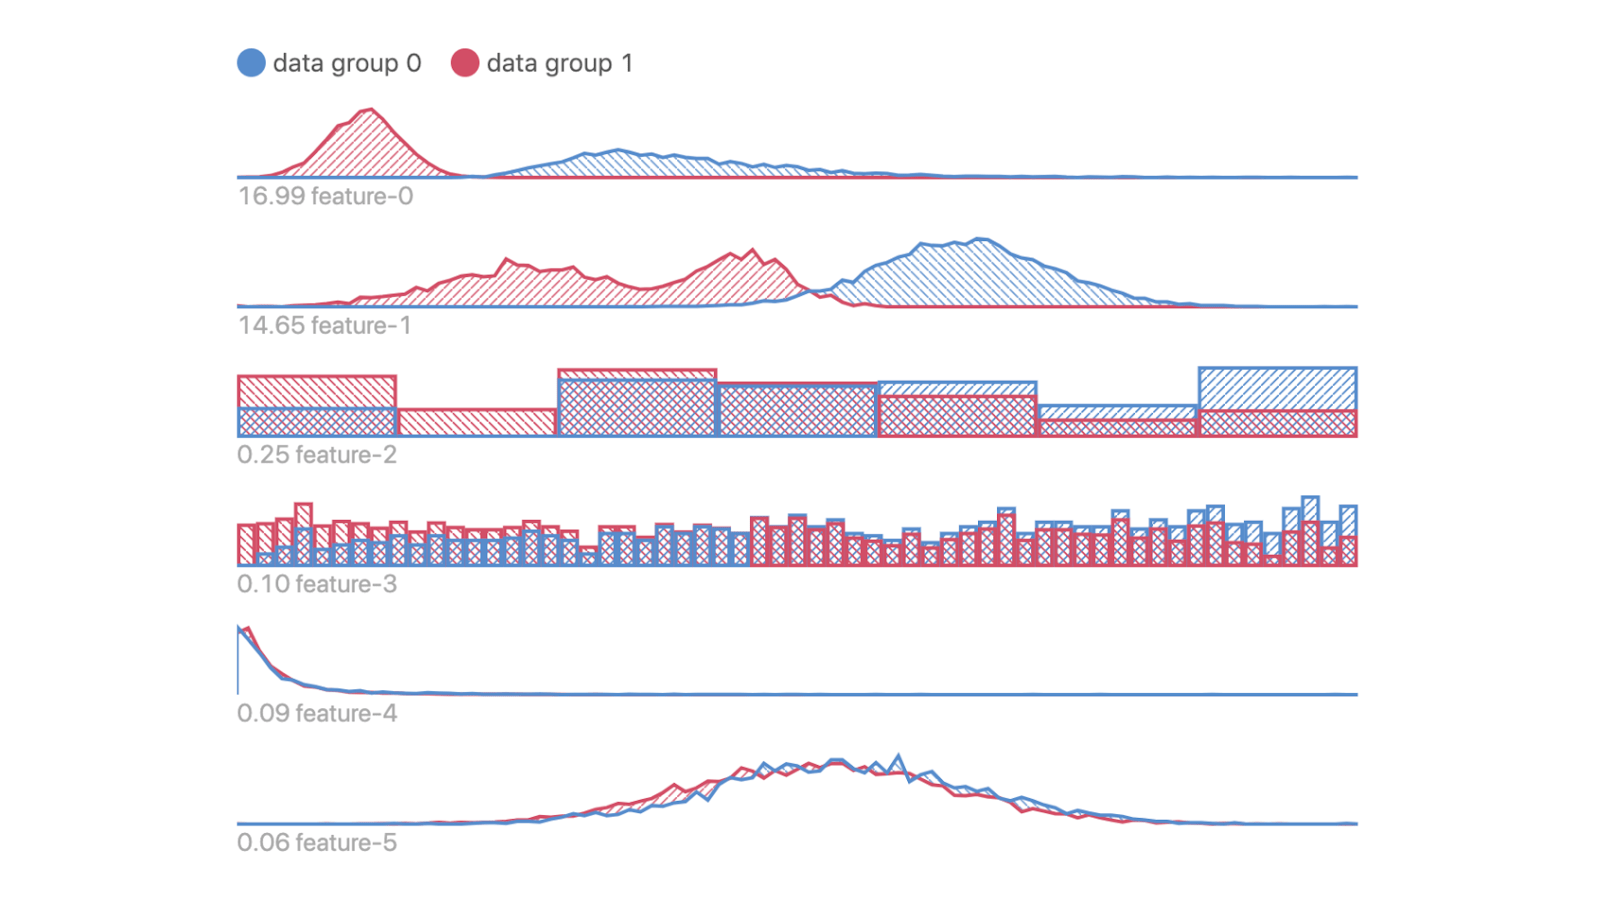
- Feature Attribution View
This shows feature values of your data clubbed together by user-defined segments. Identify any input feature distribution that might correlate with inaccurate prediction output. You can differentiate between two distributions in each feature. The distributions here represent the difference in data from the two-segment groups selected in the performance comparison view.
- Geo Feature View
If the dataset contains geospatial features, it will be displayed on a map with this feature. Lat-Long coordinates and h3 hexagon IDs are currently supported feature types by Manifold. It shows differences in geo-location between two segment groups by representing the spatial distribution difference between the two subsets selected previously.

This advanced platform for debugging tools is surprisingly easy to use and very extensible:
- It runs in Jupyter Notebook and shows real-time visualizations of machine learning training, letting you perform key analysis as well.
- It’s quite flexible too; it lets you customize visualizations.
- It has a unique ability called lazy logging mode. This executes arbitrary queries against a live ML training process and returns the result of that query, showing them in the choice of your visualizer.
See Tutorials and Notebooks to dive deeper into the features of TensorWatch.
Efemarai is a unique Python tool for visualizing, inspecting, and debugging. It can be used for investigating explainability, robustness, and more, apart from the basic usage. Let’s look at some of its features:
- It can build intuitive 3D visualizations of large multidimensional tensors as well as automatically generated computational graphs. This helps you focus on the data closely by letting you visually inspect it.

- It has features that empower you to effortlessly inspect any tensor or tensor elements that aren’t explicitly handled (like gradient tensor) in a few clicks. This gives access to all the values used or generated by your code.
- All the assertions (defined by you) are monitored automatically, so you quickly detect violations of your assumptions about the data or the behavior of your code.
- It tracks tensor gradients when available, easing optimization procedures.
SageMaker is scalable and extensible. How well does it debug?
- It captures training metrics in real-time and helps you analyze and optimize your ML models.
- It constantly tracks the training process, so it can automatically terminate the training process. This reduces the time and cost of training ML models, improving efficiency.
- It can automatically profile and monitor system resource utilization in real-time and send alerts when predefined bottlenecks are identified.
- It supports a wide range of ML algorithms and DL frameworks.
- It’s not open-source, so if you’re looking for a tool for experimenting or starting new, this isn’t the right tool for you. If you want to monitor your model while training and perform real-time analysis, then this tool does the job well.
Conclusion
Machine learning systems are trickier to test than traditional software since we’re not explicitly writing. I’ve shown you some debugging strategies for ML models, and the tools to implement them, then we dove into inspecting our model and discussed model interpretability. We also looked at model debugging tools that trace the path of errors from the input to the output.
I hope all of this helped you understand ML debugging better. Thank you for reading! Here’s what you can read next to learn more:
Further reading
Papers
- TensorFuzz: Debugging Neural Networks with Coverage-Guided Fuzzing
- A responsible machine learning workflow with focus on interpretable models, post-hoc explanation, and discrimination testing
- On the art and Science of Explainable Machine Learning
Blog posts
- How to test machine learning code and systems
- How to Trust your Deep Learning Code
- Model Assertions for Debugging Machine Learning
- Effective testing for Machine Learning
Conferences
Videos
- Identifying and Fixing Biased AI
- Unit Testing for Data Science
- Black-box and glass-box explanation in ML
Books
